Coastal Flooding Risk Index (SXI)
Usecase: Charleston, SC Flood Risk - ALL FEATURES
Data Summary
The graph below illustrates flood categories based on Mean Lower Low Water (MLLW) thresholds, providing insights into their representation within the data used for this case study.
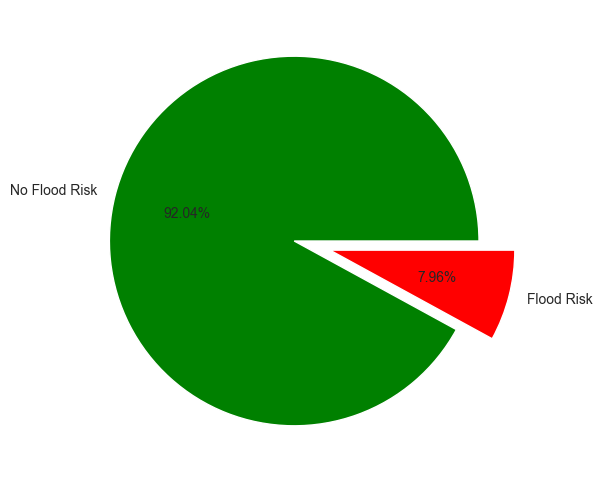
- No Flood: (MLLW is < 6.5 ft) – 1908 records (92.04%)
- Action: (MLLW >= 6.5 ft < 7 ft) – 156 records (7.53%)
- Minor Flooding: (MLLW >= 7ft < 7.5 ft) – 9 records (0.43%)
New Target Variable: Flood Risk
- No Flood: Will flagged as No Risk (92.04%)
- Both Action & Minor Flooding will be flagged as Flood Risk. (7.96%)
Time Series Analysis:
- Observed Data: January 01, 2019 to September 03, 2024
- Forecasted Data: September 04, 2024 to March 03, 2025
| LSTM | RMSE |
|---|---|
| DAILY | 0.05 |
Time Series - Performance Metrics Table
Analysis:
- The majority of forecasted days (87.3%) indicate no risk of flooding.
- Approximately 8.8% of the days reach the Action Stage, indicating the potential for elevated water levels but not yet reaching flood conditions.
- Minor Flooding is predicted for 3.9% of the forecasted days, indicating a moderate risk of localized flooding.
SCORE + CORRELATE = IMPROVE
No. of Independent Features = 53
No. of Rows = 2073 (01-01-2019 to 03-09-2024)
| List of Features | |
|---|---|
| Charleston Mainset (14 Features) | Wind Speed (kn) |
| Wind Dir (deg) | |
| Wind Gust (kn) | |
| Air Temp (°F) | |
| Baro (mb) | |
| Water Temp (°F) | |
| Precipitation(in) | |
| Snowfall(in) | |
| Snow_Depth(in) | |
| Heating_Degree_Days_(F) | |
| Cooling_Degree_Days(F) | |
| Growing_Degree_Days(F) | |
| Modified_Growing_Degree_Days(F) | |
| Depth to water level_feet below land surface | |
| Ashley River Data (10 Features) |
Ashley_Gage height(Mean_ft) |
| Ashley_Water Temp_degC (max) | |
| Ashley_Water Temp_degC (min) | |
| Ashley_Water Temp_degC (mean) | |
| Ashley_SpecificConductance at 25C(max) | |
| Ashley_SpecificConductance at 25C(min) | |
| Ashley_SpecificConductance at 25C(mean) | |
| Ashley_Dissolved oxygen_mg/L (max) | |
| Ashley_Dissolved oxygen_mg/L (min) | |
| Ashley_Dissolved oxygen_mg/L (mean) | |
| North Atlantic Region Hurricane Data | Tropical Storm |
| Hurricane | |
| Major Hurricane | |
| List of Features | |
|---|---|
| Wando River Data (9 Features) | Specific conductance_(µs/cm) at 25C_MIDDLE_WR |
| Dissolved oxygen(mg/L)_MIDDLE_WR | |
| Water Temp_MIDDLE_WR | |
| Gage Height_WR | |
| Specific conductance_(µs/cm) at 25C_BOTTOM_WR | |
| Dissolved oxygen(mg/L)_BOTTOM_WR | |
| Water Temp_BOTTOM_WR | |
| Discharge_(ft3/s)_WR | |
| Mean water velocity for discharge computation(ft/s)_WR | |
| Cooper River Data (9 Features) | Cooper_GageHeight(ft) |
| Cooper_Water Temp_TOP | |
| Cooper_Specific conductance_TOP | |
| Cooper_DissolvedOxygen(mg/L)_TOP | |
| Cooper_Water Temp_BOTTOM | |
| Cooper_Salinity(ppt)_BOTTOM | |
| Cooper_Stream water level elevation above NAVD 1988(ft) | |
| Cooper_Specific conductance_BOTTOM | |
| Cooper_DissolvedOxygen(mg/L)_BOTTOM | |
| Moon Phase Data (8 Features) | Moon_Phase_First Quarter |
| Moon_Phase_Full Moon | |
| Moon_Phase_Last Quarter | |
| Moon_Phase_New Moon | |
| Moon_Phase_Waning Crescent | |
| Moon_Phase_Waning Gibbous | |
| Moon_Phase_Waxing Crescent | |
| Moon_Phase_Waxing Gibbous | |
Target Feature Info :
| Target Feature - SXI++LNM Master Model | ||||||||
|---|---|---|---|---|---|---|---|---|
| MLLW | Outcomes | Train_Test Set Savannah + Charelston |
Unseen Test Set-1 Charleston |
Unseen Test Set-2 Savannah |
||||
| Charleston | Savannah | Count | % | Count | % | Count | % | |
| >=6.5 ft | >=9.2 ft | Flood Risk | 268 | 8.26 | 35 | 7.78 | 32 | 7.1 |
| <6.5 ft | <9.2 ft | No Flood Risk | 2978 | 91.74 | 415 | 92.22 | 418 | 92.89 |
Data Split for Training:
| Train_Test Set | Train Count | 1451 (70%) |
|---|---|---|
| Test Count | 415 (20%) | |
| Validate Count | 207 (10%) | |
| Total | 2073 |
SXI Distribution on Flood Risk
Distribution of Flood Risk
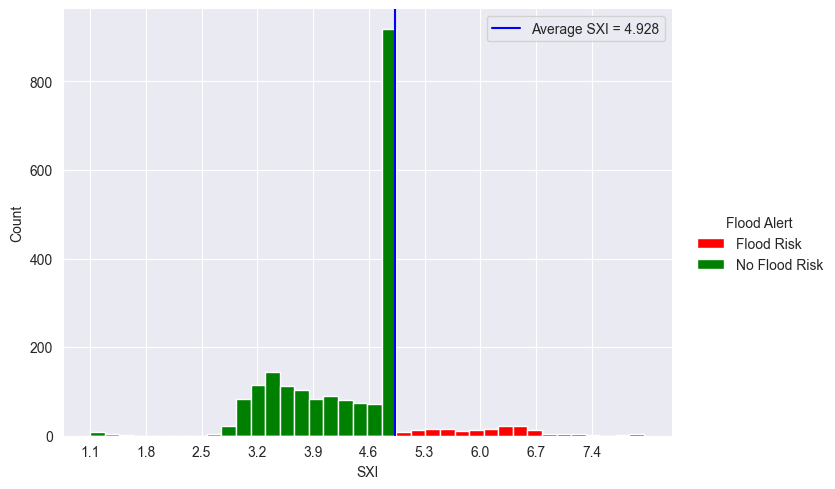
- 2073 observations were distributed to 1908 days with No Flood Risk and 165 days with Flood Risks. So, 92.04% No Flood Risk and 7.96% Flood Risk during the period January 1, 2019 to September 3,2024.
- An SXI score above 4.928 accurately indicates Flood Risk, while a score above 4.928 indicates more of No Flood Risks. This clear demarcation showcases the strong classification ability of SXI.
- Flood Risk Above SXI score of 4.928 is 100%
- Flood Risk Below SXI score of 4.928 is 0%
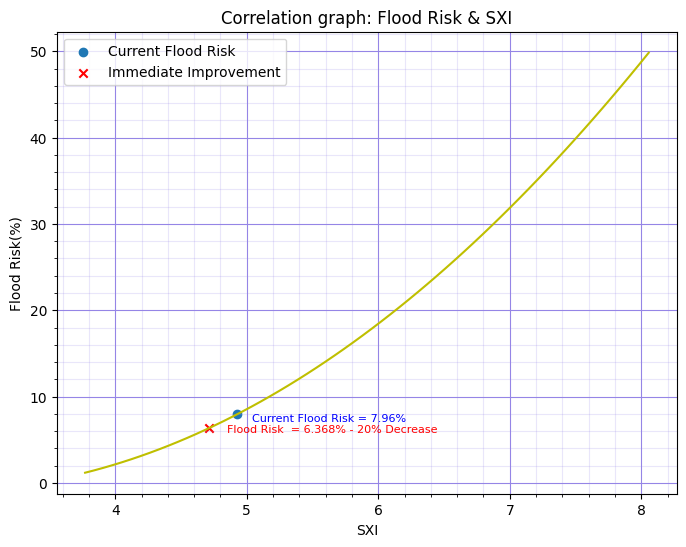
The correlation between SXI and Flood Risk is 0.999. This implies that SXI and Flood Risk are highly positively correlated to each other. Hence, a decrease in SXI will result in a decrease in Flood Risks.
Performance Metrics:
| Auto-ML | SXI | SXI++ | |
|---|---|---|---|
| Accuracy (%) | 93.01% | 95.18% | 100% |
| Precision (%) | 78.57% | 90.90% | 100% |
| AUC | 0.931 | 0.946 | 1 |
SXI++LNM Performance Metrics:
| Data Used | Features | Accuracy | Precision | AUC | |
|---|---|---|---|---|---|
| Mainset 1 | Charleston | 53 | 99.99% | 99.99% | 1 |
| Blind Test 1 | Savannah | 62 | 93% | 91.84% | 0.946 |
| Mainset 2 | Savannah | 62 | 99.99% | 99.99% | 1 |
| Blind Test 1 | Charleston | 53 | 95.50% | 93.04% | 0.967 |
| SXI++LNM on Master Data | ||||||
|---|---|---|---|---|---|---|
| Data Used | Features | Rows | Accuracy | Precision | AUC | |
| Master Data | Charleston + Savannah | 98 | 1623 | 99.76% | 96.97% | 0.999 |
| Blind Test 1 | Charleston | 53 | 450 | 96.94% | 94.5% | 0.976 |
| Blind Test 2 | Savannah | 62 | 450 | 94.33% | 92% | 0.951 |
Current Decision Tree:
- Current Flood Risk: 7.96%
- Current SXI: 4.928
No Flood Risk:
- Mean Gauge Height of Ashley River <= 9.525 ft
- Specific Conductance at 25degC measured at the river bed (Bottom) of Wando River <= 41551 µs/cm
- Dissolved Oxygen measured at the (Top) surface of Cooper River >= 4.304 mg/L
- Wind Direction <= 298 deg
Flood Risk:
- Mean Dissolved Oxygen of Ashley River <= 3.95 mg/L
- Wind Gust <= 13.02 kn
- Dissolved Oxygen measured at the (Top) surface of Cooper River <= 4.99 mg/L
- Dissolved Oxygen measured at the river bed (Bottom) of Cooper River >= 4.73 mg/L
- Mean Water Velocity for discharge computation of Wando River >= -0.113 ft/s
Target Decision Tree:
- Target Flood Risk: 6.368% (20% decrease)
- Target SXI: 4.716
No Flood Risk:
- Stream Water level Elevation above NAVD 1988 of Cooper River <= 1.03 ft
- Maximum Specific Conductance at 25degC of Ashley River <= 40140 µs/cm
- Dissolved Oxygen measured at mid depth of Wando River >= 3.69 mg/L
- Specific Conductance at 25degC measured at the river bed (Bottom) of Wando River >= 22730 µs/cm
Flood Risk:
- Water Temperature measured at mid depth of Wando River <= 32.907 degC
- Specific Conductance at 25degC measured at the surface (Top) of Cooper River <= 42831 µs/cm
- Salinity measured at the river bed (Bottom) of Cooper River <= 3.606 ppt
- Barometric Pressure at Charleston >= 812.384 millibars


